Copy the Test or Production service links from the Builder Project.

Open Microsoft Excel and create a Blank Worksheet.
Go to Data → Get Data → From Other sources → From OData Feed
In the OData feed popup, select the basic radio button, and paste the service link you copied from builder Project. Type your OutSystems runtime username and password when prompted.
Excel will now connect to Hubway and seamlessly fetch all the Entities that are part of your project. Select all the Entities that are needed for your analysis and click Load.
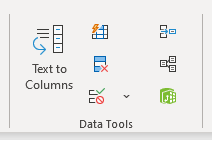
You can establish relationships between Entities within excel by going to Data → Relationship icon under Data Tools section of the menu.

Here you can create a new relationship between entities by selecting the Related Tables and their Primary and Foreign Key columns.

You are now set to build insightful analytics leveraging the power of Hubway.
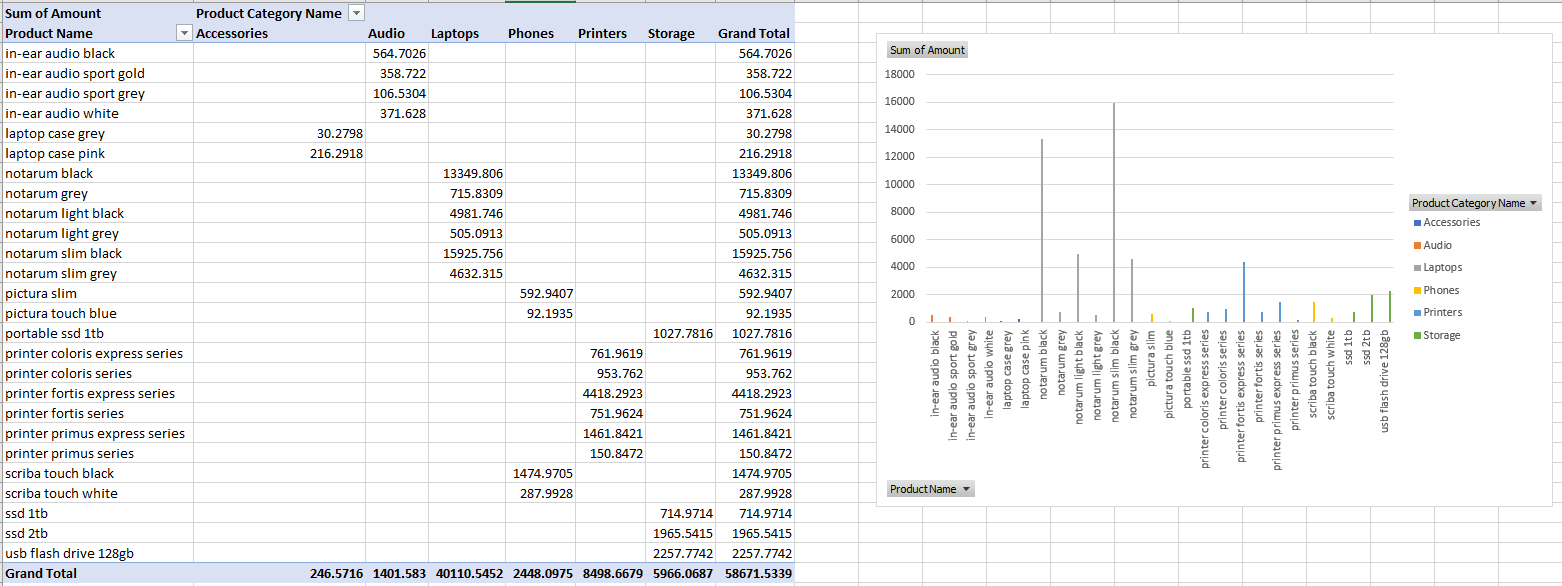
Taking the Order Manager service as an example, you can build a visual of the Total Order amount per Product Category by going to Insert → Pivot Charts → Pivot Charts and Pivot Table under the Charts section of the menu.
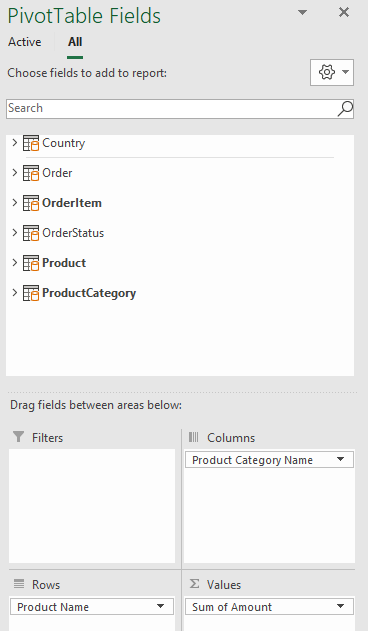
In the Pivot Charts Field, select the related fields to build the chart as below:


